 Miles Sisk
The median home in America now costs five times the median household income. In 1985 it was three and a half times; through the 1990s, about three. What does that mean? Americans starting from scratch, going from renter to homeowner without family help, have to save and dedicate larger portions of their income to it than any generation before them.
The price-to-income ratio, 1985 to 2025Show the math
Harvard's Joint Center for Housing Studies puts the national median home price at about five times median household income in its 2025 report, up from roughly three times through the 1990s. A longer series assembled by Visual Capitalist from Census and NAR data runs the ratio from about 3.5 in 1985 to about 5 in 2025. The two sources agree on the shape: flat near three for two decades, then a climb that began around 2000, dipped after 2008, and resumed after 2012.
Sources: Joint Center for Housing Studies, The State of the Nation's Housing 2025 (Harvard University, Oct 6, 2025); Visual Capitalist, U.S. home price to income ratio 1985 to 2025. A full pop-out on this math is earmarked as its own post.
Whether my fellow left-leaning Americans like to acknowledge the reality of market dynamics or not, we have a supply issue. There are simply more people than there are houses to put them in, and while the economy runs hot, a limited and inelastic housing supply will keep rising in price until we let the market adjust to demand. Some think demand will fall on its own. It won't fall fast enough, so it's time to make adjustments: for neighborhoods to pull up their big-boy pants, open up the zoning code, and make clear, easy paths for new higher-density housing in all neighborhoods, without the lengthy design review processes that do real harm. The current model is hurting young Americans and our growth as a nation.
We still live in a democratic system, and asking neighborhoods to give up their power is not something that will happen easily or overnight. We can take action like the State of Oregon, which in 2019 required its larger cities to allow duplexes on every residential lot and up to fourplexes in cities over 25,000, or we can look for more granular approaches to adding higher-density housing in older neighborhoods while preserving the high-quality historic building stock we already have.
After all, we aren't building any new Victorians. It is a shame to see a 130-year-old Victorian mansion torn down and replaced by a fourplex while a 1970s snout-nose, garage-first single-family house stands untouched next door. Decades of NIMBYism have proven that we can't trust neighborhoods to respond responsibly to higher demand for housing; many neighbors work deliberately to hold up new projects with the goal of limiting supply in high-demand areas, and so increasing their own property wealth. So now state legislatures are stepping in to make the supply changes themselves, at larger and less surgical scales than neighbors and cities could have managed on their own, and what we are left with is unhappy neighbors and uglier outcomes. What states ought to demand instead is that every neighborhood allocate new housing within its plans in line with past and predicted population growth, rather than pushing growth to the edges of cities, eating farmland and adding traffic.
Neighborhoods ought to be forced to accept change, growth and new housing, no matter how quaint or "historic." But neighbors ought to be armed with the tools to choose how and where that growth goes, in ways that preserve what their communities value most. We need a democratic system that lets neighbors plan the future growth of their community, lock it in, and then step out of the way so that developers have a clear and seamless path to delivering the housing we need.
Here is the distinction that makes that possible. Seeing it was easy; piecing together the solutions has taken me years. Neighborhoods cannot be trusted with whether; the share has to be assigned from above. They can absolutely be trusted with where and what, once the number is fixed. One Saturday in Portland proved it.
Dynamic Density is a method Rick Potestio, Jonathan Konkol and I worked out together in Portland. After I left for Chicago they refined it under ReUrbanist Collaborative and ran it in Irvington. It works in three steps. The neighborhood inventories its blocks and decides what is off-limits: buildings, trees, businesses, whatever it would actually fight to keep. It receives a specified number of new homes, its share of anticipated growth. And it places them on the remaining properties by choosing from a menu of pre-war multifamily building types that Rick and Jonathan measured off real buildings, walking Portland with cameras and tape measures. It is a board game with a budget.
Inventory what is off-limits, receive the number, place the rest from a menu of measured building types.
1. Inventory
2. The number
3. Place
In February 2024 a couple dozen neighbors in Portland's Irvington Historic District played it with Legos. Three teams, 600 units each, on a map already color-coded for contributing and non-contributing buildings. One team got mostly duplexes and fourplexes, one got mid-sized buildings, one got a few towers. Every team sacrificed the non-contributing buildings first; nobody had to tell them to. The small-building team had the hardest afternoon and the most demolitions, and concluded their scenario would not pencil in a neighborhood that expensive. The teams with a few taller buildings touched fewer sites and saved more. Jonathan's summary is the hinge of this whole series:
"One can minimize changes in the scale of buildings, their bulk and height, or one can minimize demolitions of existing buildings by keeping the footprint of change small and going up. Mathematically, one cannot do both."
That is my Victorian and my snout-nose house, decided on purpose instead of by accident. It is also the answer to the Lincoln Park teardowns in the last post: left to lot-by-lot economics, "gentle" infill eats the two-flats. Allocation has to be by type, at neighborhood scale, or the market allocates for you.
To place the same 600 homes, a team could keep buildings small or keep demolitions few. Not both.
The base map with the teams' placements, a team at work, and the menu of measured building types the Lego pieces stood for.

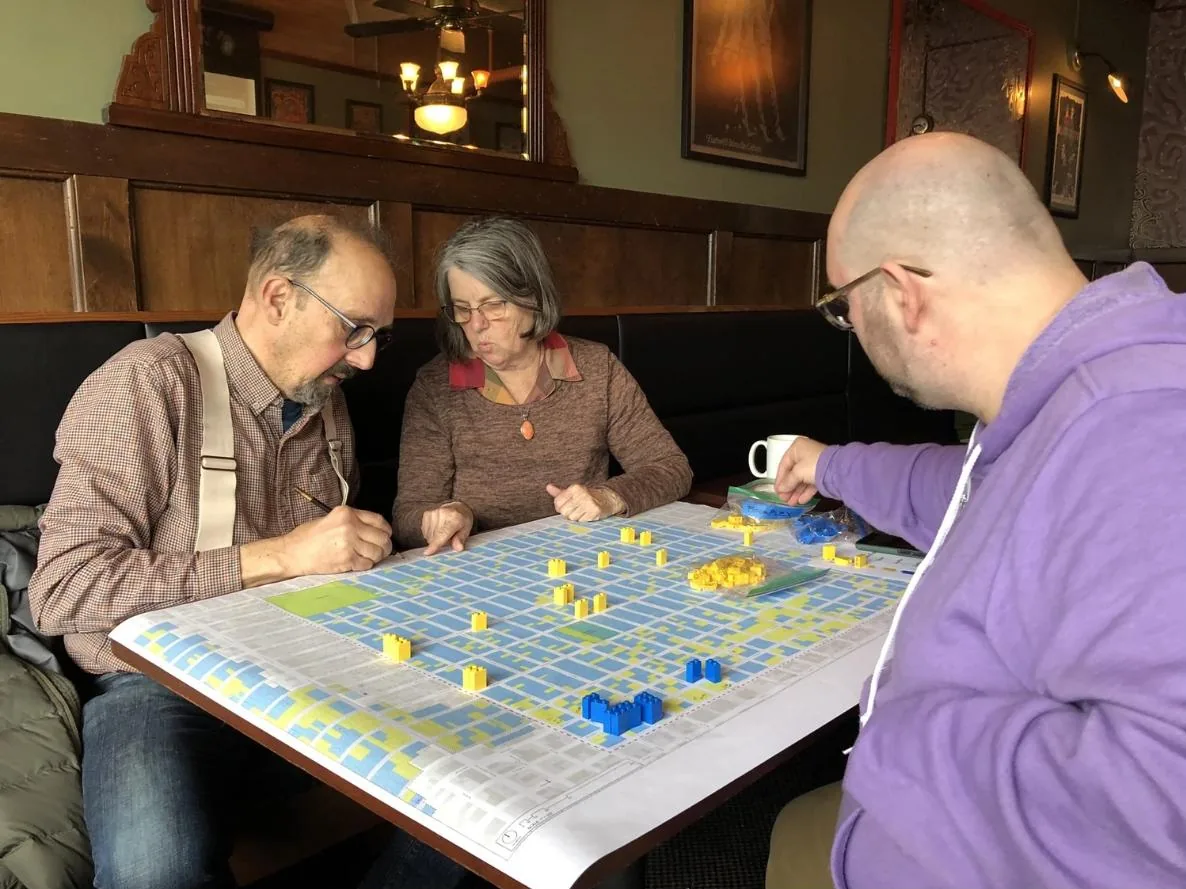
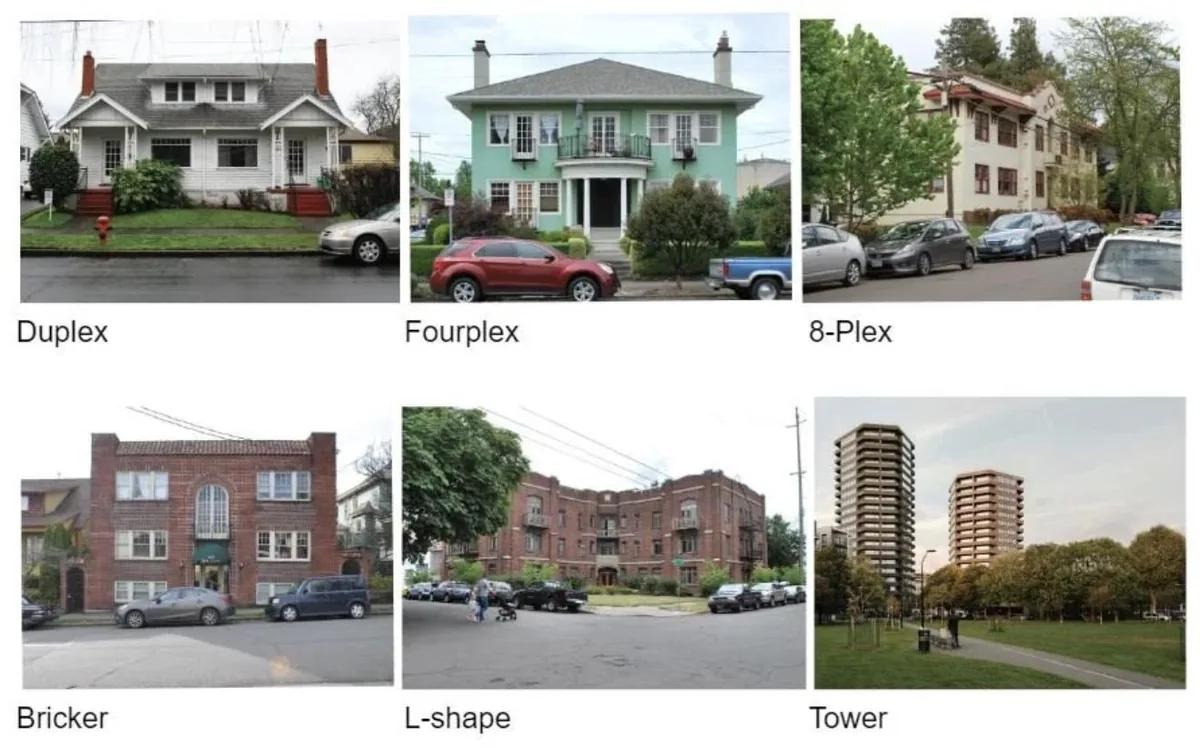
The Irvington workshopShow the math
Date: February 2024, hosted with the Irvington Community Association, Portland. Format: three teams, each given 600 new homes to place on a base map color-coded by contributing and non-contributing status in the historic district, with Lego blocks scaled to a menu of measured building types.
- Team A (duplexes and fourplexes): the most sites touched, the most demolitions, and a conclusion from the team that the scenario would not pencil in Irvington at current land prices.
- Team B (mid-sized, three to five stories): fewer sites, fewer demolitions.
- Team C (a few taller buildings): the fewest sites touched and the most contributing buildings saved.
All three teams took the non-contributing buildings first without being told to. The trade-off Jonathan names in the post (bulk versus demolitions) came out of the teams' own results, not the facilitators' framing.
Source: Jonathan Konkol, Plan Design Xplore, Irvington Dynamic Density workshop write-up (2024); ReUrbanist Collaborative, Dynamic Density materials.
Chicago already lets neighborhoods decide, by the way. It just does it through one person, after the fact, one parcel at a time. Aldermanic prerogative is the unwritten custom that gives the local alderperson final say on zoning in their ward. Half a mile from Lincoln Yards, Sterling Bay's 1840 N. Marcey proposal took a year and a public fight before a negotiated deal passed in July 2025, with no reference to any neighborhood-wide target, because none exists. The same month, a citywide ordinance allowing coach houses and basement units stalled; it passed in September only after being converted back into ward-by-ward alderperson approval with a menu of optional restrictions. That is neighborhood control as Chicago practices it: the right authority, at the wrong end of the process, bound to no number. Dynamic Density moves that same authority to the front, in public, against a target. The alderperson becomes the convener of the allocation instead of its gatekeeper, which, if I were an alderperson, is the job I would rather have.
Same authority, moved from the end of the process to the front.
The prerogative record, 2018 to 2025Show the math
| When | What happened |
|---|---|
| Nov 2018 | Fair housing groups file a federal civil rights complaint arguing aldermanic prerogative over zoning blocks affordable housing in majority-white wards. |
| 2024 to July 2025 | Sterling Bay's 1840 N. Marcey (615 units, Lincoln Park) goes through a year of hearings and a procedural end-run before the alderperson negotiates support; passes July 2025. |
| July 2025 | Citywide accessory dwelling unit ordinance (coach houses, basement units) stalls in Council. |
| Sep 2025 | ADU ordinance passes after conversion to ward-by-ward opt-in with a menu of optional restrictions each alderperson may apply. |
Sources: Chicago Area Fair Housing Alliance and Shriver Center complaint (2018); Block Club, Sun-Times, WTTW and Urbanize Chicago reporting on 1840 N. Marcey and the ADU ordinance, 2024 to 2025.
Irvington's afternoon worked because the map already existed. Chicago's does too. The Chicago Historic Resources Survey spent thirteen years rating roughly 500,000 pre-1940 buildings by color, and the red and orange layer sits on the city's open data portal right now. Every landmark district designation report lists contributing and non-contributing properties parcel by parcel. The inventory step is done citywide; we just never did anything with it. Take Logan Square's boulevards: 265 acres of graystone two- and three-flats built between 1890 and 1930, a Chicago Landmark since 2005, the Blue Line running straight through it, and a neighborhood association that already argues about exactly these questions. The workshop it would need has its map, its building types and its blocks. What it lacks is the number.
Every building the Chicago Historic Resources Survey rated orange along the boulevards, with the decade it was built. Hover a dot.
The Historic Resources Survey and the Logan Square districtShow the math
The Chicago Historic Resources Survey ran from 1983 to 1995 and looked at roughly 500,000 buildings built before 1940, assigning a color code for significance. The red (most significant) and orange (significant in context) layer, about 17,000 properties, is published on the city's data portal. Its limits: it predates 1995, it covers pre-1940 buildings only, and it was a windshield survey, so individual ratings need checking. A citywide update has been proposed but not funded.
The Logan Square Boulevards District: about 265 acres along Logan, Kedzie and Humboldt boulevards and Palmer Square; National Register of Historic Places 1985; Chicago Landmark 2005. The designation report lists contributing properties parcel by parcel. The dominant types are graystone and brick two- and three-flats, 1890 to 1930.
Sources: City of Chicago, Historic Resources Survey (data portal layer and Commission on Chicago Landmarks description); Logan Square Boulevards District landmark designation report (2005); National Register nomination (1985).
Nobody has told Logan Square its number. The next post is about what happens once it has one: the pickup.